
Many organizations rely on recurring reports to monitor sales performance, operational metrics, financial activity, customer trends, or project progress. Although these reports may appear simple, the preparation process often involves repetitive manual work: copying data between files, correcting formatting issues, updating formulas, rebuilding charts, and checking whether different versions contain the same information.
A repeatable reporting template changes this process by separating the structure of a report from the data being analyzed. Instead of recreating the same report from scratch every week or month, teams can build a standardized framework that accepts new data while maintaining consistent calculations, formatting, and presentation.
The goal is not only to save time. A well-designed reporting template reduces opportunities for human error, improves data quality, and makes reports easier for different team members to maintain. Data management guidance from organizations such as the U.S. Geological Survey emphasizes that standardized templates can reduce errors by controlling how information is collected, stored, and entered.
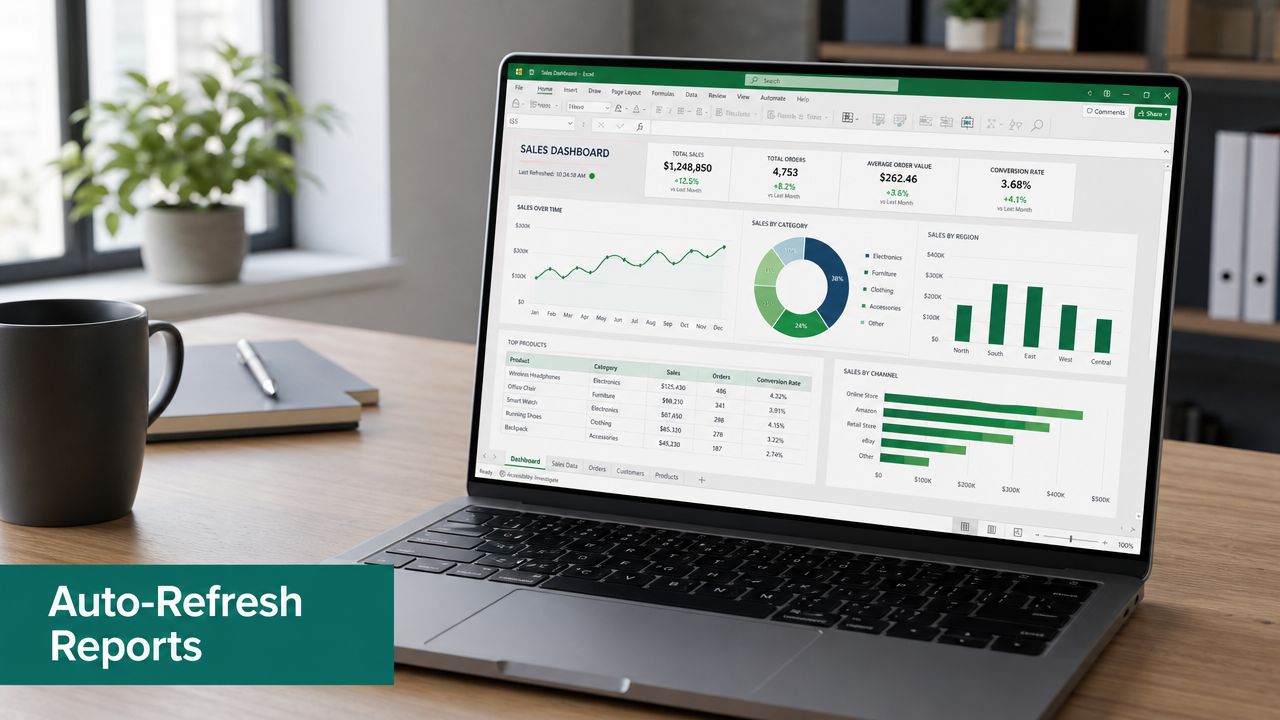
A common mistake is creating a template by focusing on visual appearance first. Adding colors, charts, and formatting may make a report look professional, but those elements do not solve underlying data problems.
A reliable reporting template begins with a clear structure:
What questions should the report answer?
Who will use the information?
Which metrics are essential?
Where does the data come from?
Which steps should happen automatically?
For example, a monthly sales report might require revenue totals, product performance, regional comparisons, and sales trends. The template should define where each metric appears and how it is calculated before any formatting decisions are made.
A strong structure usually separates different functions into individual sections or worksheets:
Raw Data: Imported information from source systems
Data Preparation: Cleaning, filtering, and transformation steps
Calculations: Formulas, metrics, and supporting logic
Report Output: Tables, charts, and summaries for readers
This separation makes troubleshooting easier because users can identify whether a problem comes from incoming data, calculations, or presentation.
Reporting templates are only as reliable as the information entering them. If source data changes every reporting cycle, automation becomes difficult and errors become more likely.
Before creating a reusable report, define consistent rules for data entry and structure. Important standards include:
Consistent column names
Defined data types
Standard date formats
Approved category names
Clear rules for missing values
Unique identifiers for records
For example, a customer report should not contain three variations of the same category, such as “United States,” “USA,” and “U.S.” These values may represent the same thing to a human reader but can produce incorrect calculations when grouped in a spreadsheet.
Data templates are especially useful because they create predictable expectations for users entering information. The U.S. Geological Survey recommends using standardized headers, consistent terms, and validation methods to improve data reliability.
A data dictionary can also help. This document explains what each field means, what type of information belongs in it, and how values should be formatted. Without these definitions, different employees may interpret the same metric differently.
Manual data entry is one of the biggest causes of reporting inefficiency. Every time information is copied and pasted, there is a possibility of missing rows, changing formulas, or introducing formatting errors.
A better approach is to create templates that pull information from existing sources whenever possible.
Common options include:
Database connections
Spreadsheet imports
API integrations
Automated exports from business systems
Query-based data refresh tools
For example, instead of manually copying monthly sales numbers into a dashboard, a reporting template can connect to a structured data table and refresh calculations automatically.
Spreadsheet tools such as Excel provide templates that allow organizations to create reusable analysis structures instead of rebuilding reports repeatedly. Microsoft documents that Excel templates can support recurring analysis tasks by providing standardized workbooks that can be customized and shared.
Automation does not mean removing all human involvement. The most effective systems still include review steps where users verify unusual results, confirm data completeness, and investigate unexpected changes.
A reporting template should make calculations consistent, but poorly designed formulas can create new problems.
Avoid building reports that depend on:
Hardcoded numbers inside formulas
Hidden manual adjustments
References to specific cell locations that may change
Duplicate calculations across multiple sheets
Instead, use structured references, named ranges, or clearly organized calculation areas.
For example, rather than creating separate formulas for every department’s monthly revenue, a better design uses a consistent calculation method that can update automatically when new records are added.
Documentation is also important. A future user should understand why a calculation exists and how it works without needing to reverse-engineer the spreadsheet.
Government spreadsheet guidance recommends using formulas appropriately, maintaining consistent naming conventions, and managing versions carefully to reduce errors when files are shared or updated.
A reporting template should be built for long-term use, not just the person who originally created it.
Good maintenance practices include:
Worksheet names, fields, and formulas should describe their purpose. Names such as “Sales_Data” or “Monthly_Summary” are easier to understand than vague labels like “Sheet1” or “Final2.”
If users only need to enter new data, protect formulas and calculation areas to prevent accidental changes.
A short guide inside the workbook can explain:
Where to add data
How often to refresh information
Which fields are required
Who owns the report
Reports often evolve over time. Version numbers and update dates help teams identify the correct template and understand when changes were introduced.
Consistent versioning is especially important when multiple people share and modify reporting files. The UK Government Digital Service recommends clear naming, version tracking, and consistent column structures as spreadsheet management practices.
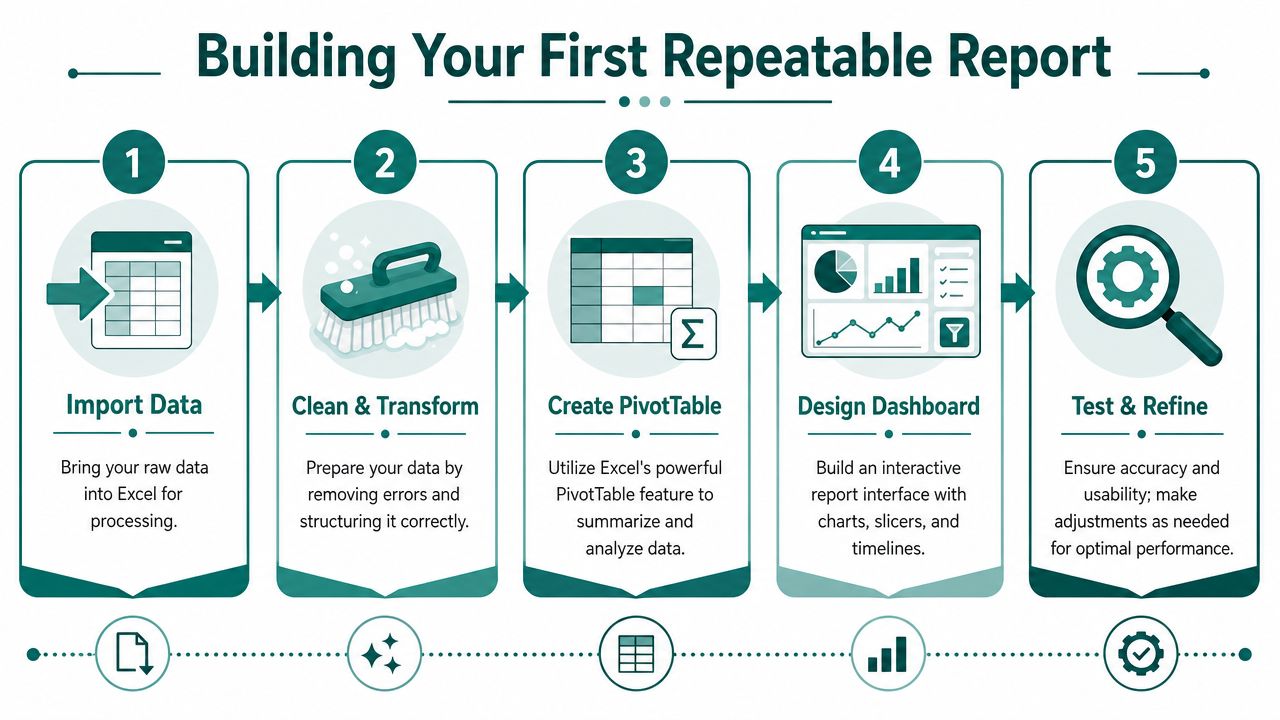
A reporting template should be tested with realistic data before becoming part of a recurring workflow.
Testing should include:
Adding new records
Checking formula results
Reviewing charts and summaries
Testing missing or unusual values
Confirming that refresh processes work correctly
A template that works with one month of data may fail when the volume increases or when unexpected values appear.
Testing is particularly important for reports used by multiple departments because different users may interact with the template in different ways.
Reporting templates are powerful, but they have limits. A spreadsheet-based solution may become difficult to maintain when:
Data volumes become extremely large
Many users edit the same file simultaneously
Complex business rules require frequent changes
Multiple systems need to be integrated
Audit requirements become more demanding
At that point, organizations may need dedicated reporting platforms, databases, or analytical applications.
The purpose of a repeatable reporting template is not to replace every data system. It is to create a reliable bridge between raw information and useful insights.
Creating repeatable reporting templates is one of the simplest ways to improve reporting efficiency and data consistency. A strong template reduces repetitive manual work by standardizing inputs, organizing calculations, and creating a predictable reporting process.
The most effective templates focus less on appearance and more on structure. Clear definitions, reliable data sources, documented calculations, and careful testing create reports that remain useful long after their initial creation.
When designed properly, a reporting template becomes more than a spreadsheet. It becomes a repeatable system that helps teams spend less time preparing data and more time understanding what the data means.