
Recurring reports are part of almost every growing organization. Engineering teams prepare weekly updates. Sales teams review pipeline performance. Managers document employee progress. Executives receive monthly or quarterly summaries.
The information matters, but the preparation process can be surprisingly manual. Someone has to pull numbers from several dashboards, ask colleagues for project updates, reconcile different reporting periods, and turn a collection of metrics and notes into something that other people can actually understand.
Automated reporting systems can reduce some of this work by connecting structured data pipelines with language models. Instead of asking an AI system to invent a report from scratch, a well-designed workflow gathers verified information first, analyzes it through predefined rules, and then uses a language model to turn the results into readable narrative.
That distinction matters. The database should remain the source of truth for quantitative information. The language model is most useful for explaining what the data means, organizing qualitative updates, and adapting the presentation for different audiences.
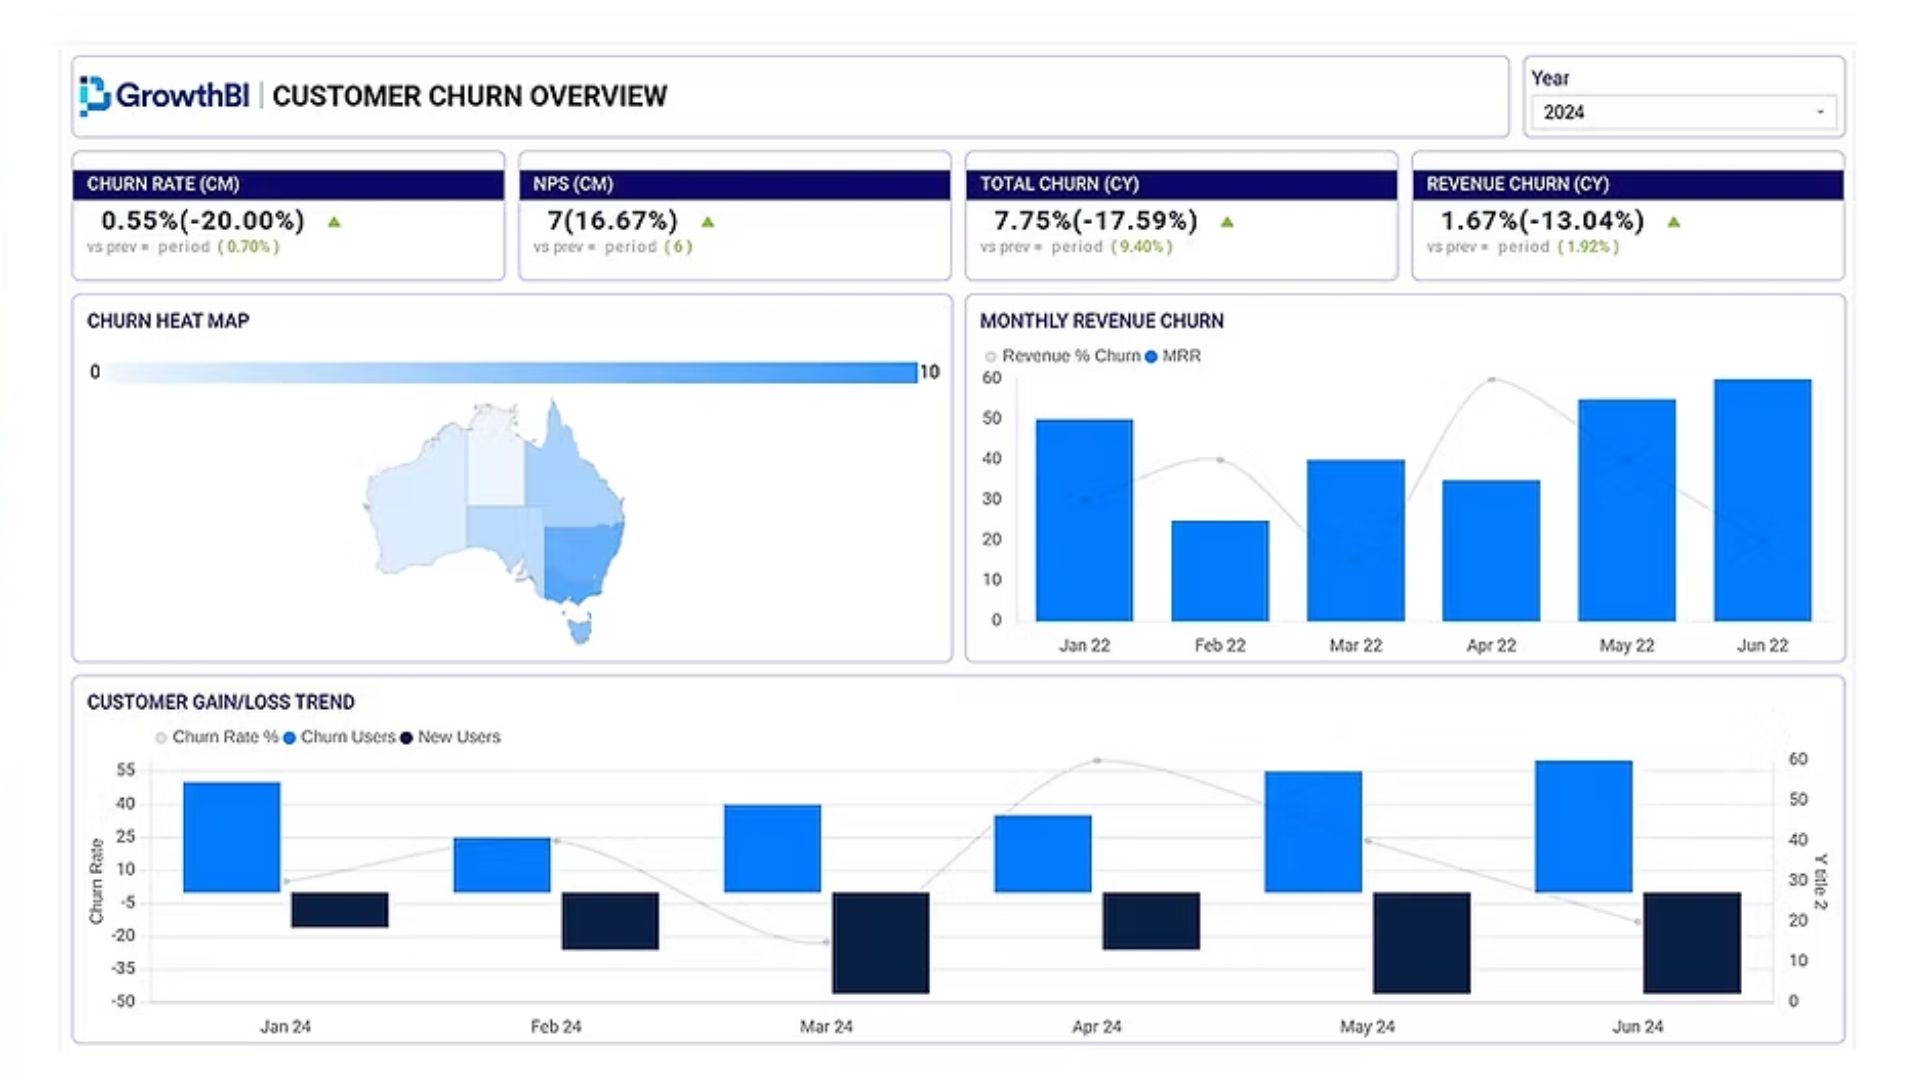
An automated reporting system is more than a prompt that says, “Write this week's report.” A production workflow normally has several distinct stages, and each one should have a clearly defined responsibility.
A practical architecture might look like this:
Data Sources → Validation → Analysis → Narrative Generation → Human Review → Distribution
Separating these stages makes the system easier to test and troubleshoot. If a revenue figure is wrong, the team can investigate the data pipeline rather than wondering whether a language model invented the number.
Data ingestion and aggregation collect information from databases, APIs, project management systems, CRM platforms, spreadsheets, or other approved sources.
Analysis and variance detection compare current results with targets, previous periods, or predefined business thresholds. This stage can rely heavily on deterministic calculations and business rules.
Narrative generation uses a language model to explain the validated results in a format appropriate for the intended audience.
Human validation and delivery give managers or other designated reviewers an opportunity to correct errors, add context, and approve the final report before distribution.
This structure keeps factual data and generated prose separate. That separation is one of the most useful design principles in automated reporting.
Weekly engineering reports often contain the same basic information: completed work, unfinished work, blockers, upcoming milestones, and changes in project status.
The problem is not necessarily that teams lack this information. Much of it already exists in systems such as version-control platforms, issue trackers, sprint boards, and project management tools. The reporting burden comes from collecting those signals and turning them into a coherent update.
An automated workflow can gather relevant activity and organize it into a standard structure.
A useful engineering summary might contain:
Key Deliverables — Major features, releases, milestones, or completed work.
Open Blockers — Technical issues or dependencies that require attention.
Upcoming Work — Important tasks or milestones expected during the next reporting period.
Selected Metrics — Relevant measures such as planned versus completed work, incident counts, or release activity.
The system should avoid treating every project-management event as equally important. A report containing fifty minor ticket updates is unlikely to help a manager understand project health.
Instead, reporting logic should identify material changes and group routine activity into concise summaries.
Automated reports can also change how teams use meetings.
If project status, blockers, and recent changes are available in a consistent report before a meeting, the discussion can focus more heavily on decisions and unresolved issues.
That does not mean automated reporting eliminates meetings. Some discussions require negotiation, technical judgment, or decisions that cannot be represented in a dashboard.
The more realistic goal is to reduce meetings that exist primarily because people need to exchange basic status information.
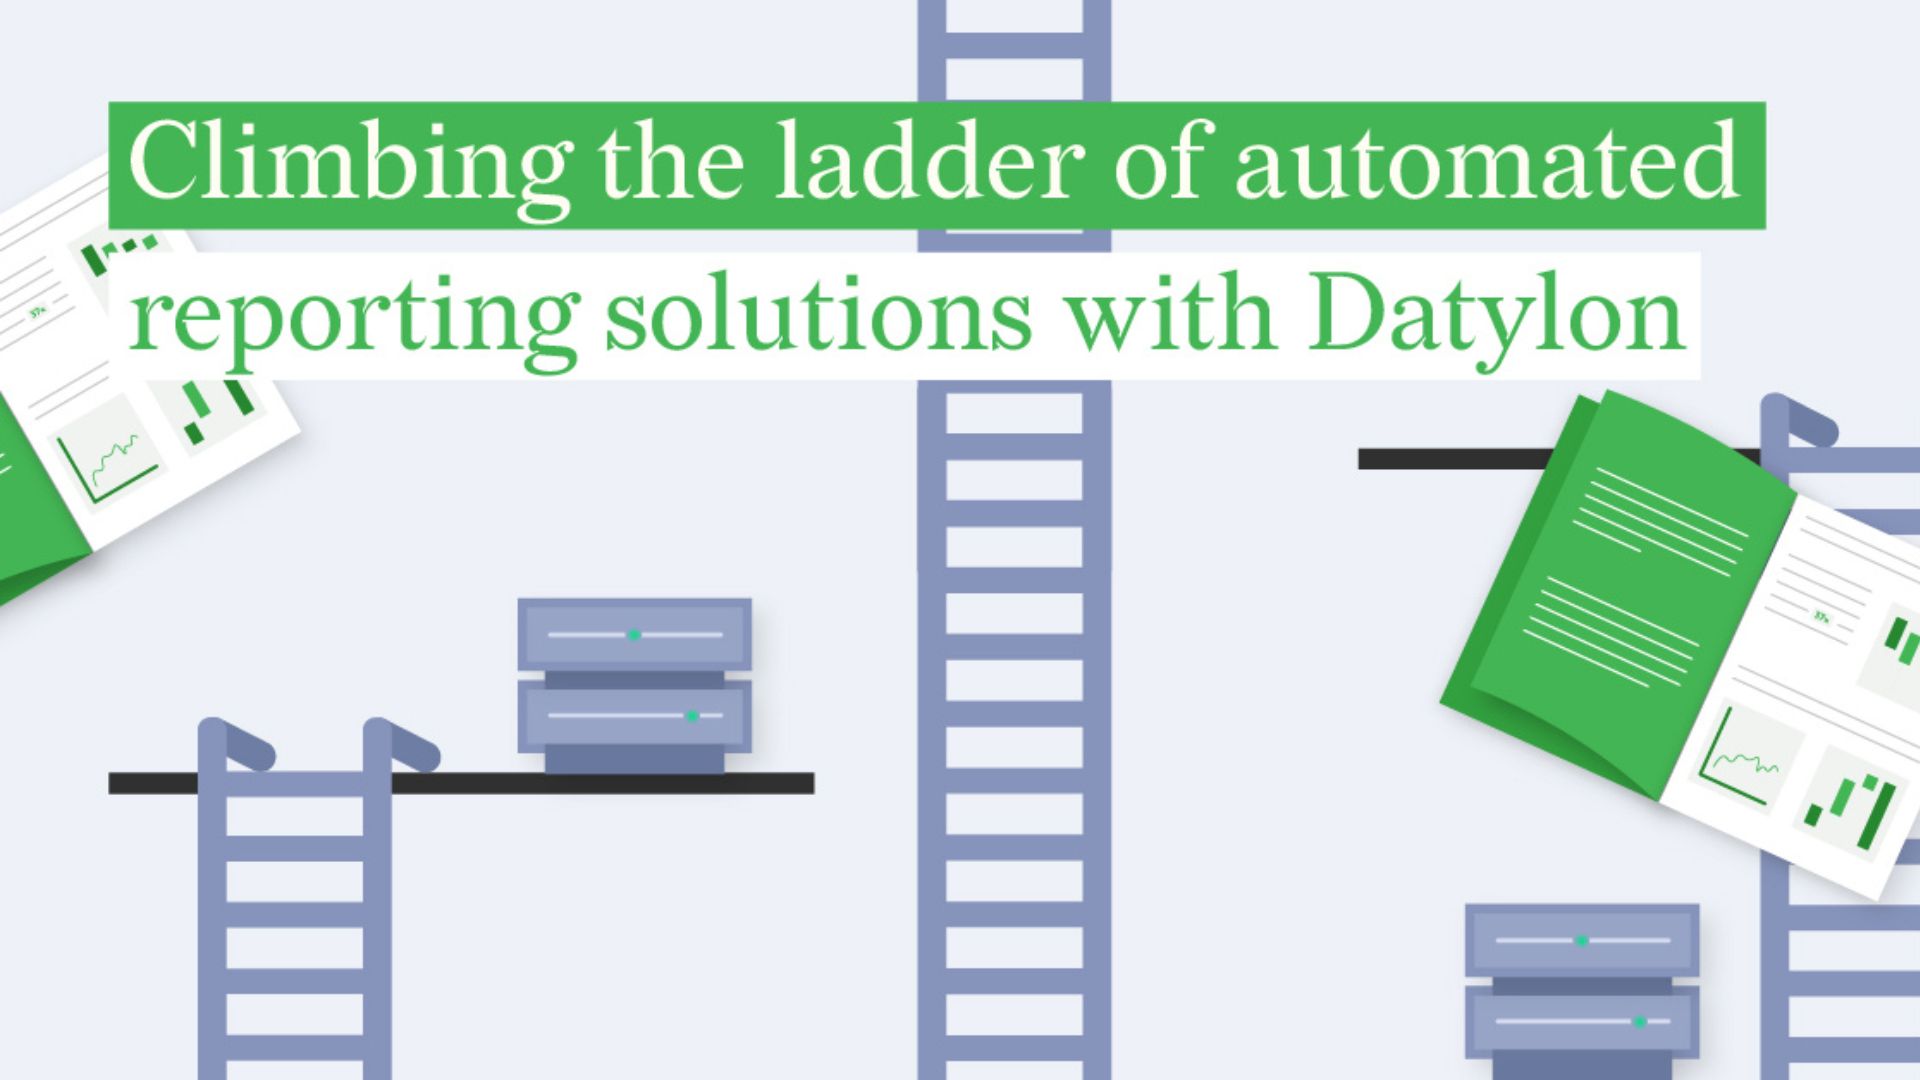
Performance reviews create a different set of challenges.
Managers often have to reconstruct months of work from project records, notes, peer feedback, and their own memory. That can make recent events disproportionately influential, especially when older accomplishments are difficult to retrieve.
A reporting system can help by maintaining a structured record of relevant work throughout the review period.
For example, it might organize:
completed projects
documented milestones
project responsibilities
peer feedback themes
agreed objectives
notable contributions
relevant development activities
The purpose should be evidence organization, not automated judgment.
AI-assisted reporting can help:
assemble a chronological record
summarize recurring themes in feedback
organize achievements by objective
identify missing documentation
prepare a first draft of review notes
Managers should remain responsible for interpreting the information.
They may need to consider:
project complexity
changing priorities
collaboration quality
mentoring
difficult assignments
circumstances not visible in operational systems
the employee's own perspective
A task-completion database cannot fully represent someone's contribution to a team. Automated reporting should therefore support managerial judgment rather than turn performance management into a numerical scoring exercise.
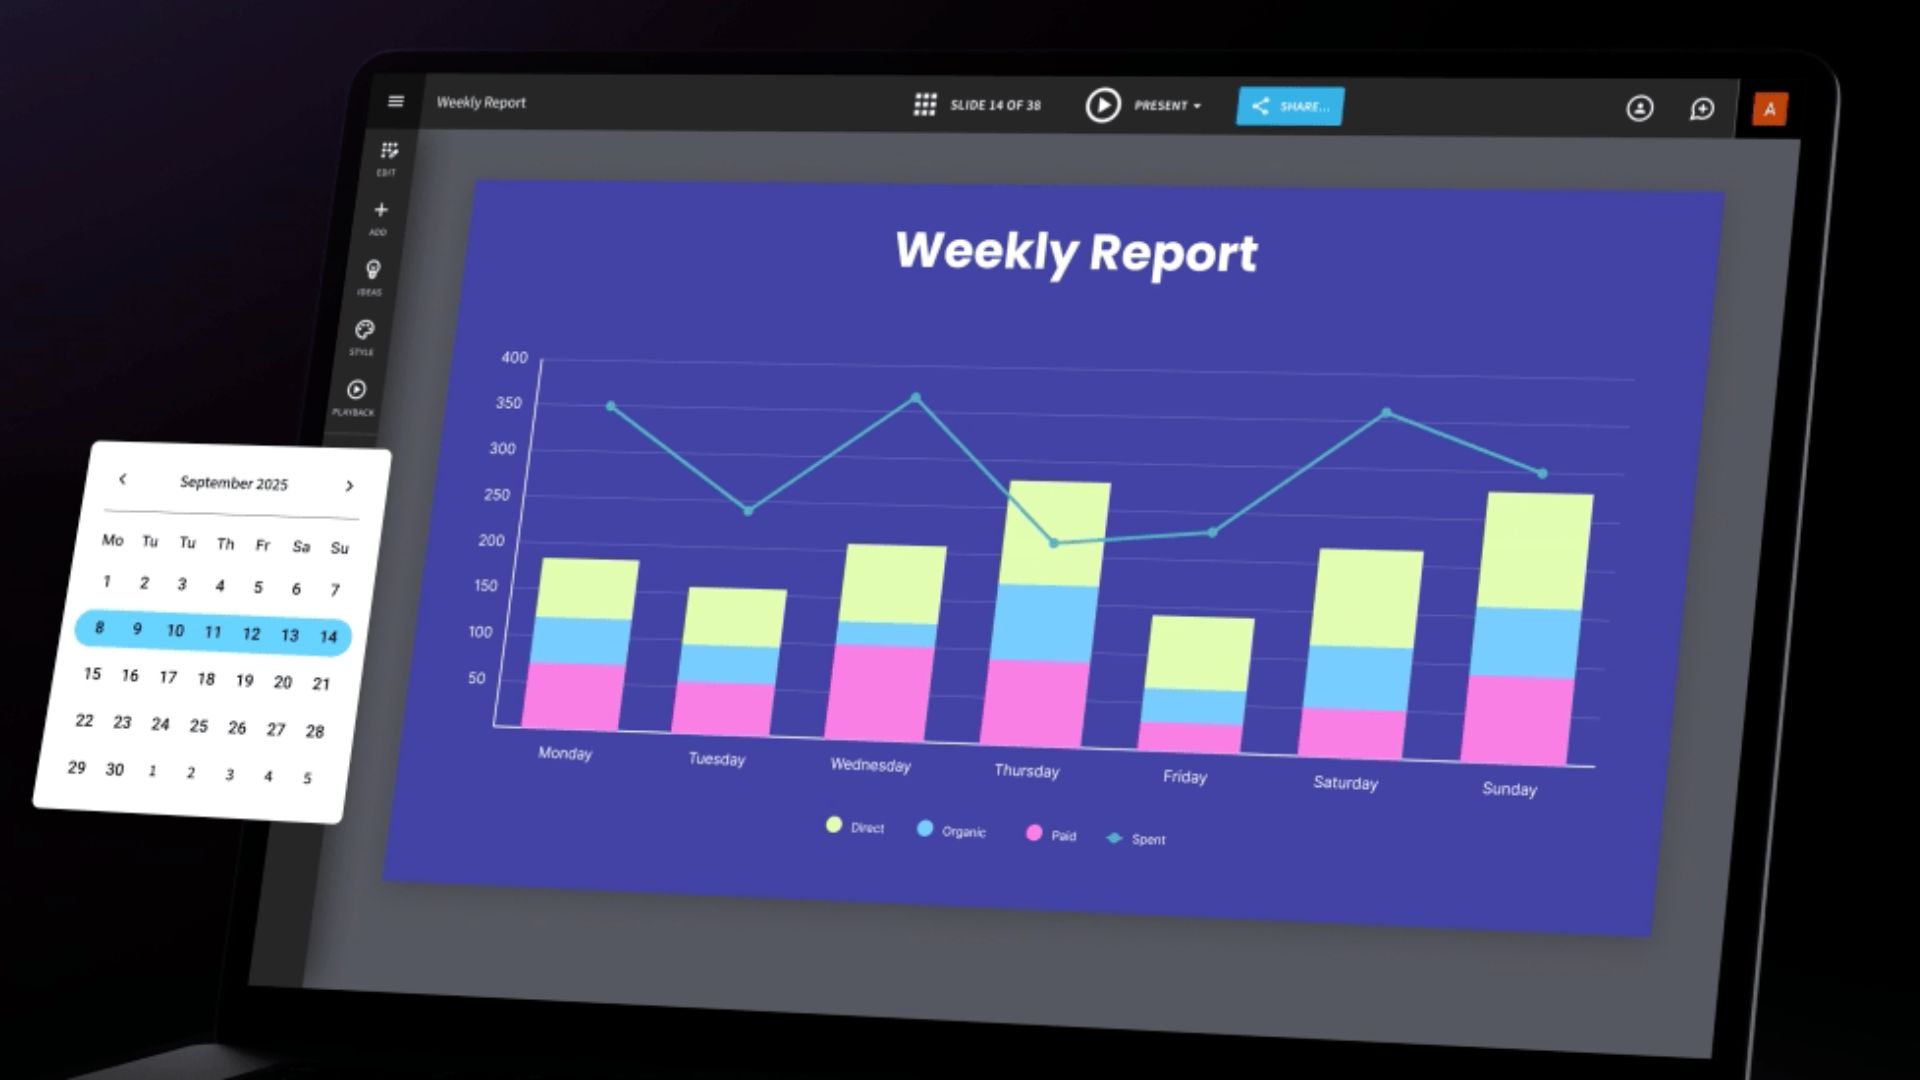
Performance information can contain sensitive employee data, so reporting architecture needs appropriate access controls.
A system should define:
who can access raw performance information
which data can be included in automated summaries
how long reports are retained
which systems can receive generated reports
when human approval is required
The same principle applies to other internal reporting. Not every metric belongs in every audience's version of a report.
The quality of an automated report depends heavily on the quality of the underlying data.
A language model cannot correct an incorrectly defined KPI simply because it can write fluent prose.
For that reason, reporting systems should establish a clear hierarchy:
Verified data → deterministic calculations → analysis → generated explanation
Critical quantitative figures should come from approved data sources rather than being invented or inferred by the language model.
For example, if the report needs to state that quarterly revenue increased by a certain percentage, the underlying calculation should happen in the data or analytics layer. The model can then explain the verified result in natural language.
This division reduces the risk of numerical errors and makes the final report easier to audit.
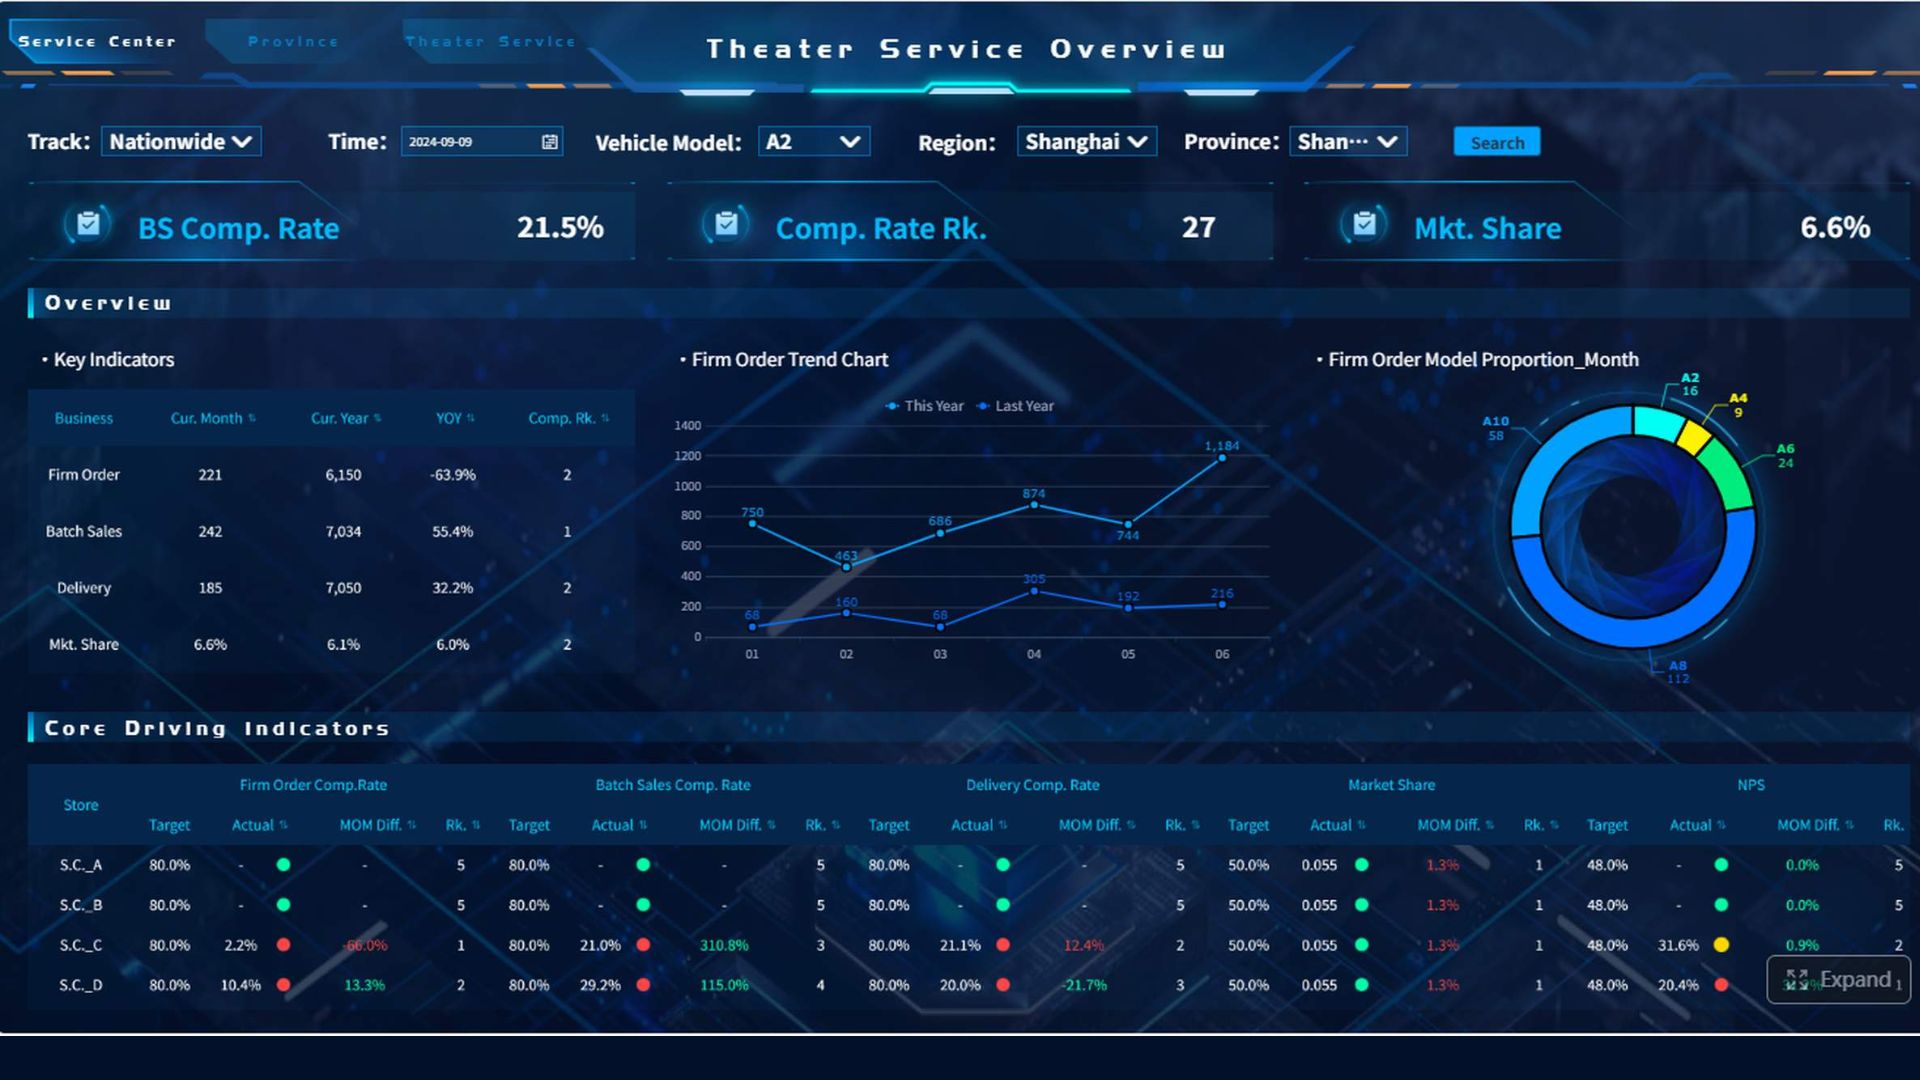
Not every change deserves a paragraph in the weekly report.
A reporting system might define thresholds for:
missed milestones
significant changes in project status
unusual sales activity
unexpected operational costs
service-level breaches
changes in important business metrics
Some thresholds can be statistical. Others are simply business rules.
For example, a two-day delay may be irrelevant for one project but critical for another because it affects a contractual deadline.
The reporting system therefore needs context, not just a generic “large change” detector.
The same underlying information can require very different presentations.
An engineering lead may want:
technical blockers
release activity
dependency issues
incident information
An executive audience may care more about:
business impact
major risks
milestone changes
resource implications
A good reporting pipeline should keep the underlying facts consistent while changing the level of detail and framing.
The data should not change simply because the audience changes. The explanation can.
Automated reporting can create a new problem if every small fluctuation becomes an alert.
When employees receive too many notifications, they eventually stop paying attention to them.
A better system applies thresholds and prioritization before generating narrative alerts.
For example:
routine changes can be grouped into a weekly summary
moderate variances can appear in a manager dashboard
critical blockers can trigger immediate notifications
This approach makes automation selective rather than noisy.
Automated reports should not automatically become authoritative simply because they were generated from structured data.
A reviewer can catch problems such as:
an outdated project status
a metric that changed definition
a missing explanation for an unusual result
a misleading summary of a team's situation
context that was never captured in the underlying system
For routine internal reports, the review may be lightweight. For sensitive employee evaluations, financial summaries, or reports distributed to external stakeholders, the review requirements should be more stringent.
The appropriate level depends on the consequences of an error.
A useful reporting system can divide responsibilities among several components:
Reporting TaskSuitable ApproachKPI collectionAPI or databaseMetric calculationDeterministic codeThreshold checksBusiness rulesVariance analysisRules and analyticsNarrative draftingLanguage modelContextual interpretationHuman review with AI assistancePerformance judgmentManagerFinal distributionAutomated workflow after approval
This division prevents the language model from becoming the sole decision-maker.
It also makes the system easier to maintain. If a KPI calculation changes, the data layer can be updated without rewriting the narrative-generation logic.
A reporting pipeline should be tested against historical examples before it becomes a routine part of business operations.
Useful tests include:
checking whether reported numbers match source data
comparing generated summaries with known business events
testing edge cases and missing data
measuring how often reviewers correct generated text
checking whether important exceptions are surfaced
verifying that reports contain only information appropriate for their audience
Historical reports are particularly useful for regression testing. If a change to the reporting prompt makes the prose better but causes important blockers to disappear, the system should not be considered an improvement.
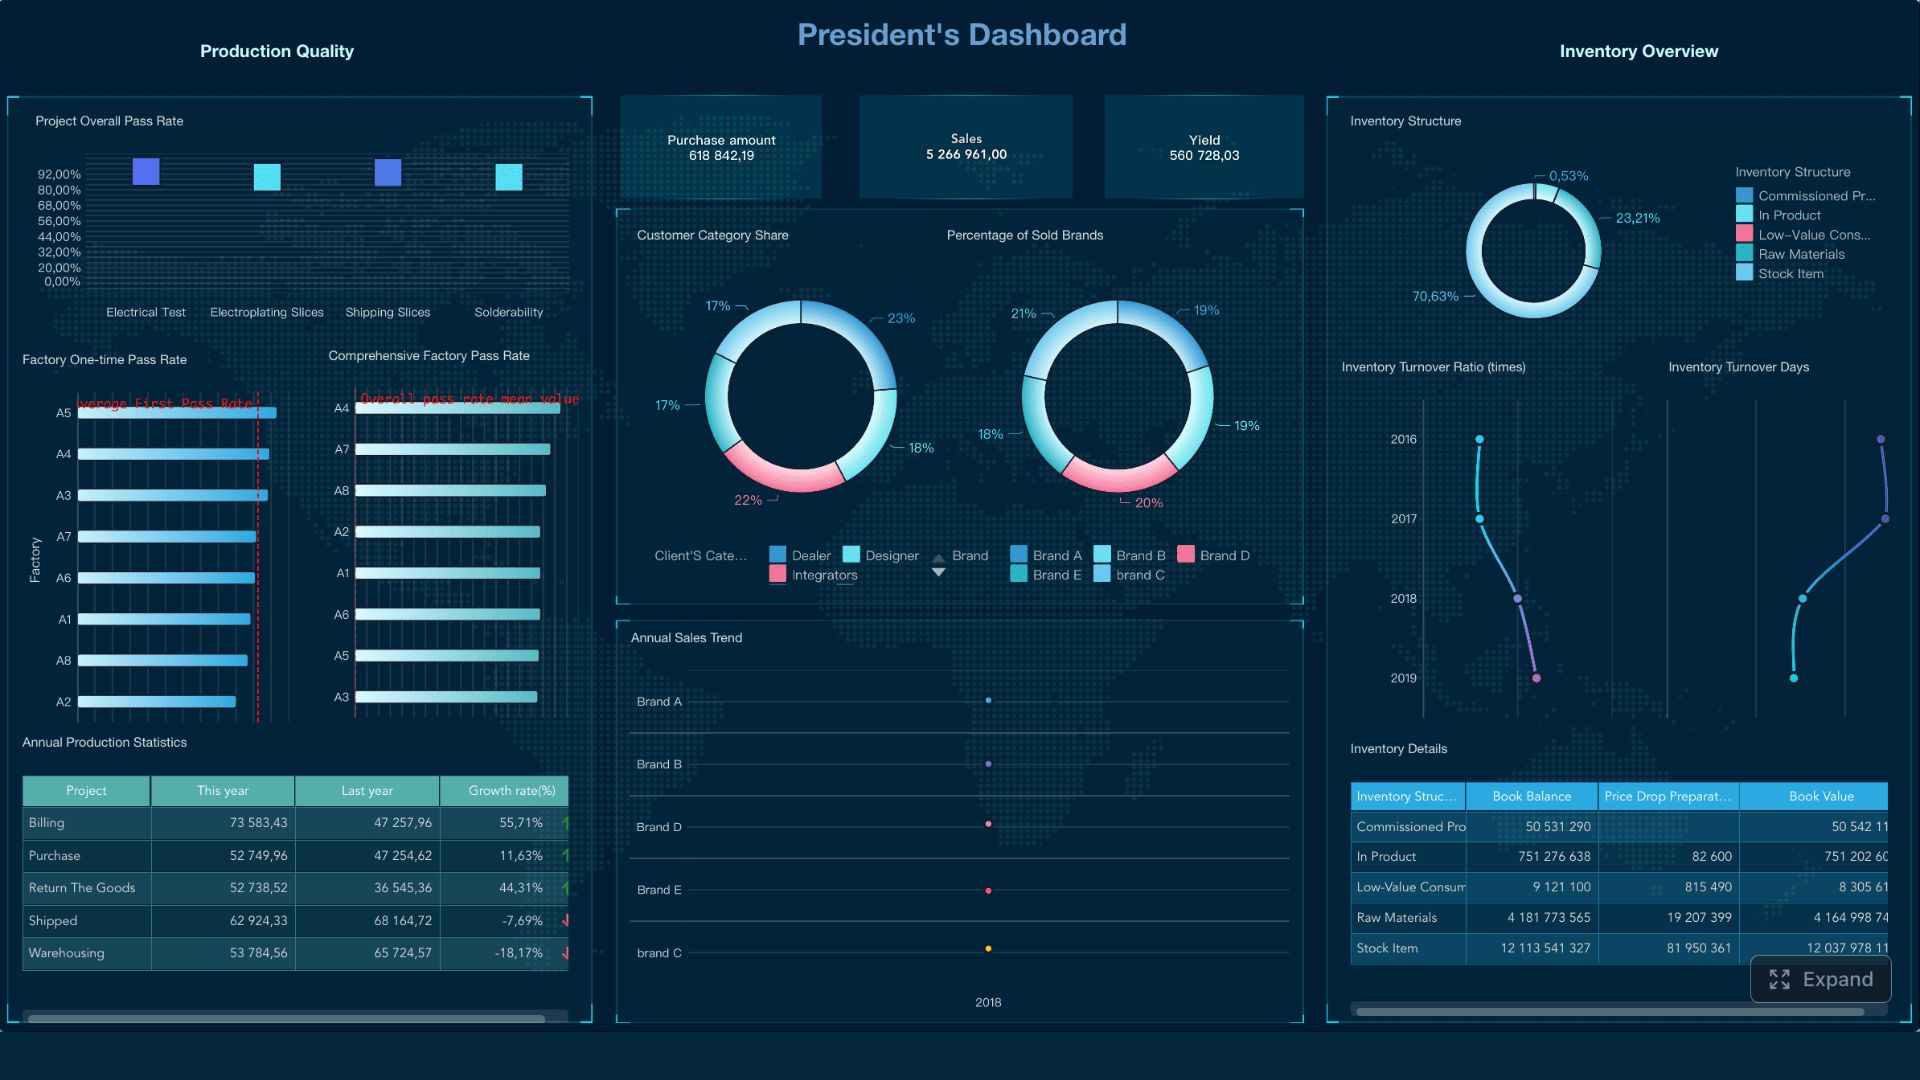
The value of automated reporting is not simply the number of minutes saved while writing a report.
Other useful measures include:
reduction in manual data collection
reduction in repetitive status meetings
time required to prepare a report
percentage of reports requiring significant correction
number of important exceptions detected
consistency between source data and published reports
reviewer satisfaction
These measures provide a clearer picture of whether automation is actually improving the reporting process.
Automated reporting works best when the system treats data collection, analysis, writing, and judgment as different responsibilities.
Databases and APIs provide verified information. Deterministic logic performs calculations and threshold checks. Language models turn validated information into readable explanations. Managers and subject-matter experts provide context and approve consequential outputs.
That division of labor is more practical than asking an AI system to produce an entire business report from an unstructured collection of data.